Ricardo Heredia
Data Scientist
Python | Machine Learning | Tableau
Data Scientist with background in medicine, who approaches problems hollistically, making assertive connections across different fields, delivering optimized and data-driven business solutions.
RETAIL FORECASTING USING MACHINE LEARNING WITH PYTHON
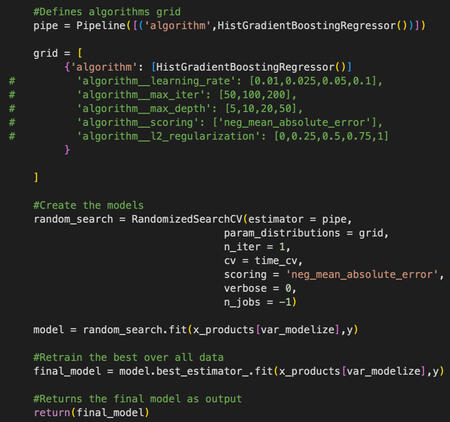
- Situation: a big retail company with two stores and 10 products by stored needed to predict sales for the next 8 days at store-product level.- Task: a 3-year historic SQL database was provided and needed to be cleaned, analyzed, preprocessed and used for making the forecast prediction for this window.- Action: the process was wrapped on several functions using Python Pandas and Sklearn with the goal to build the final datamart for prediction through different processes such as data wrangling, data quality, EDA, variable creating (assessing the Intermittent demand), feature transformation (using OneHot and Target Encoding), variable preselection (using Mutual Information) and later training (using TimeSeriesSplit for cross validation and Random Search), evaluating (on a Validation dataset) and finally executing the HistGradientBoost Regression model to predict the 8 days window prediction.- Results: after testing the correct functioning of the model we relied on MAE (5.45), it was decided to carry on with execution which showed the model successfully predicted the sales for the 8-days window thanks to the recursive forecast function.
PYTHON
Detection of inefficiencies in solar plants

- Situation: a photovoltaic solar power generation company has detected anomalous behaviors in two of the plants, and the maintenance subcontractor is unable to identify the reason.- Task: the data science team has been asked to analyze the available data and help solve the problem before deploying a team of engineers.- Action: understanding of the solar plants functioning, extensive data wrangling work with the CSV files from the plants and sensor using Pandas. A data quality assessment and creation of analytics data marts was done in order to analyze the four main levers (irradiation, solar panels, inverters efficiency and meters and sensors) on specific business moments using dates through time series analysis.- Result: after integrating the data in a unique dataset, Seaborn was used to visualize the output of the analysis through, scatterplots, lineplots, box plots, density plots and heat maps to draw conclusions presented on a PowerPoint business presentation that include conclusions over the quality of the data, the malfunctioning of one of the plants and specific moments of the inverters performance.
Python
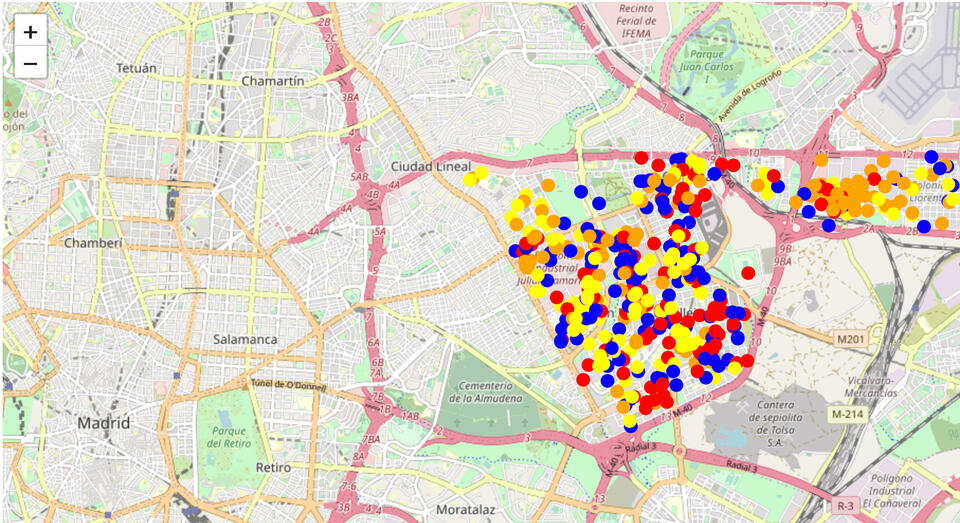
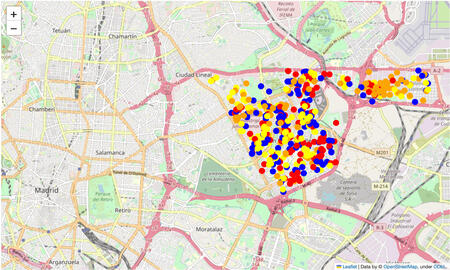
eCommerce optimization

- Situation: The company has selected the city of Madrid to search properties with investment purposes in order to obtain profits through tourist rentals and has commissioned the Data Science team to carry out a Discovery analysis that allows the identification of strategies that help direct the assessment team's actions.- Task: Use the public data sources available and analyze the rental price, occupation availability and property price to find insights.- Action: I did the ETL work by web scrapping the data from Airbnb public sources, creating a database in SQLite and building analytic datamarts with pertinent business variables for statistical analysis, to find insights, visualize them in Seaborn and make geographical maps using the Haversine distance formula in a function to calculate the main points of interest of Madrid.- Result: after analyzing the main KPIs, the insights were shown in a Jupyter Notebook's report, where I visualized the main areas with the best prices for investing in renting in Madrid. The visualizations were made with Seaborn scatter and line plots and with theuse of geographical maps using the Folium package.


